If you love SwiftUI😍, you probably also hate SwiftUI Preview😡.
This is because most developers who use SwiftUI have encountered this interface at some point:

Besides crashes, Xcode Preview often inexplicably freezes and fails to display preview effects.
When encountering these situations, since we don’t understand how Preview works, apart from handling obvious project compilation errors, we seem to only be able to solve other tricky issues by clearing caches and restarting Xcode.
To better understand the root causes of these issues, this article will explore how SwiftUI Preview works. While we can’t completely eliminate SwiftUI Preview problems, at least understanding the error logs can hopefully provide some insights for your daily development process.
TLDR: The Conclusions First
- In Xcode 16, Preview’s working mechanism has undergone significant changes. If you’re interested in how Preview worked before Xcode 16, you can read Building Stable Preview Views — How SwiftUI Preview Works
- Starting from Xcode 16, normal Build and Run process shares build artifacts with Preview, but the execution process differs, with Preview using JIT to run the artifacts
- Preview has three different levels of rebuild operations, suitable for different degrees of source code file modifications. If we use Small, Middle, and Large to represent these three operations, their differences can be shown in the following table:
| Rebuild Level | Typical Scenario | Rebuild Scope | Preview App Refresh Method |
|---|---|---|---|
| Small | Modifying string literals in methods | No rebuild | Retain original app process, re-execute methods defined in Preview macro |
| Middle | Modifying other content in methods | Only rebuild source code files with modified methods | Close original app process, start a new app instance, then execute methods defined in Preview macro |
| Large | Modifying class or struct properties, modifying global variables | Entire project rebuild, equivalent to executing a cached build and run | Close original app process, start a new app instance, then execute methods defined in Preview macro |
Let’s explore these details further in the following sections.
How to Research: Investigating Through Build Artifacts
To study how Preview works, let’s make an assumption: Preview must leave traces in Xcode’s DerivedData folder during its operation. Therefore, we can add DerivedData to Git management and observe what changes each operation brings to the DerivedData folder.
To facilitate research, we created a project called SwiftUIPreviewSample and placed the project’s DerivedData folder at the same level as .xcproject for easy viewing. You can also check each commit diff to understand how different modifications affect DerivedData.
Review: How Does a Build and Run Application Start?
Starting from Xcode 16, SwiftUI Preview’s working mechanism has changed, with the most significant change being: Build and Run and Preview share the same build artifacts. This is to allow Preview and Build and Run compilation artifacts to be reused, thereby improving Preview’s build efficiency.
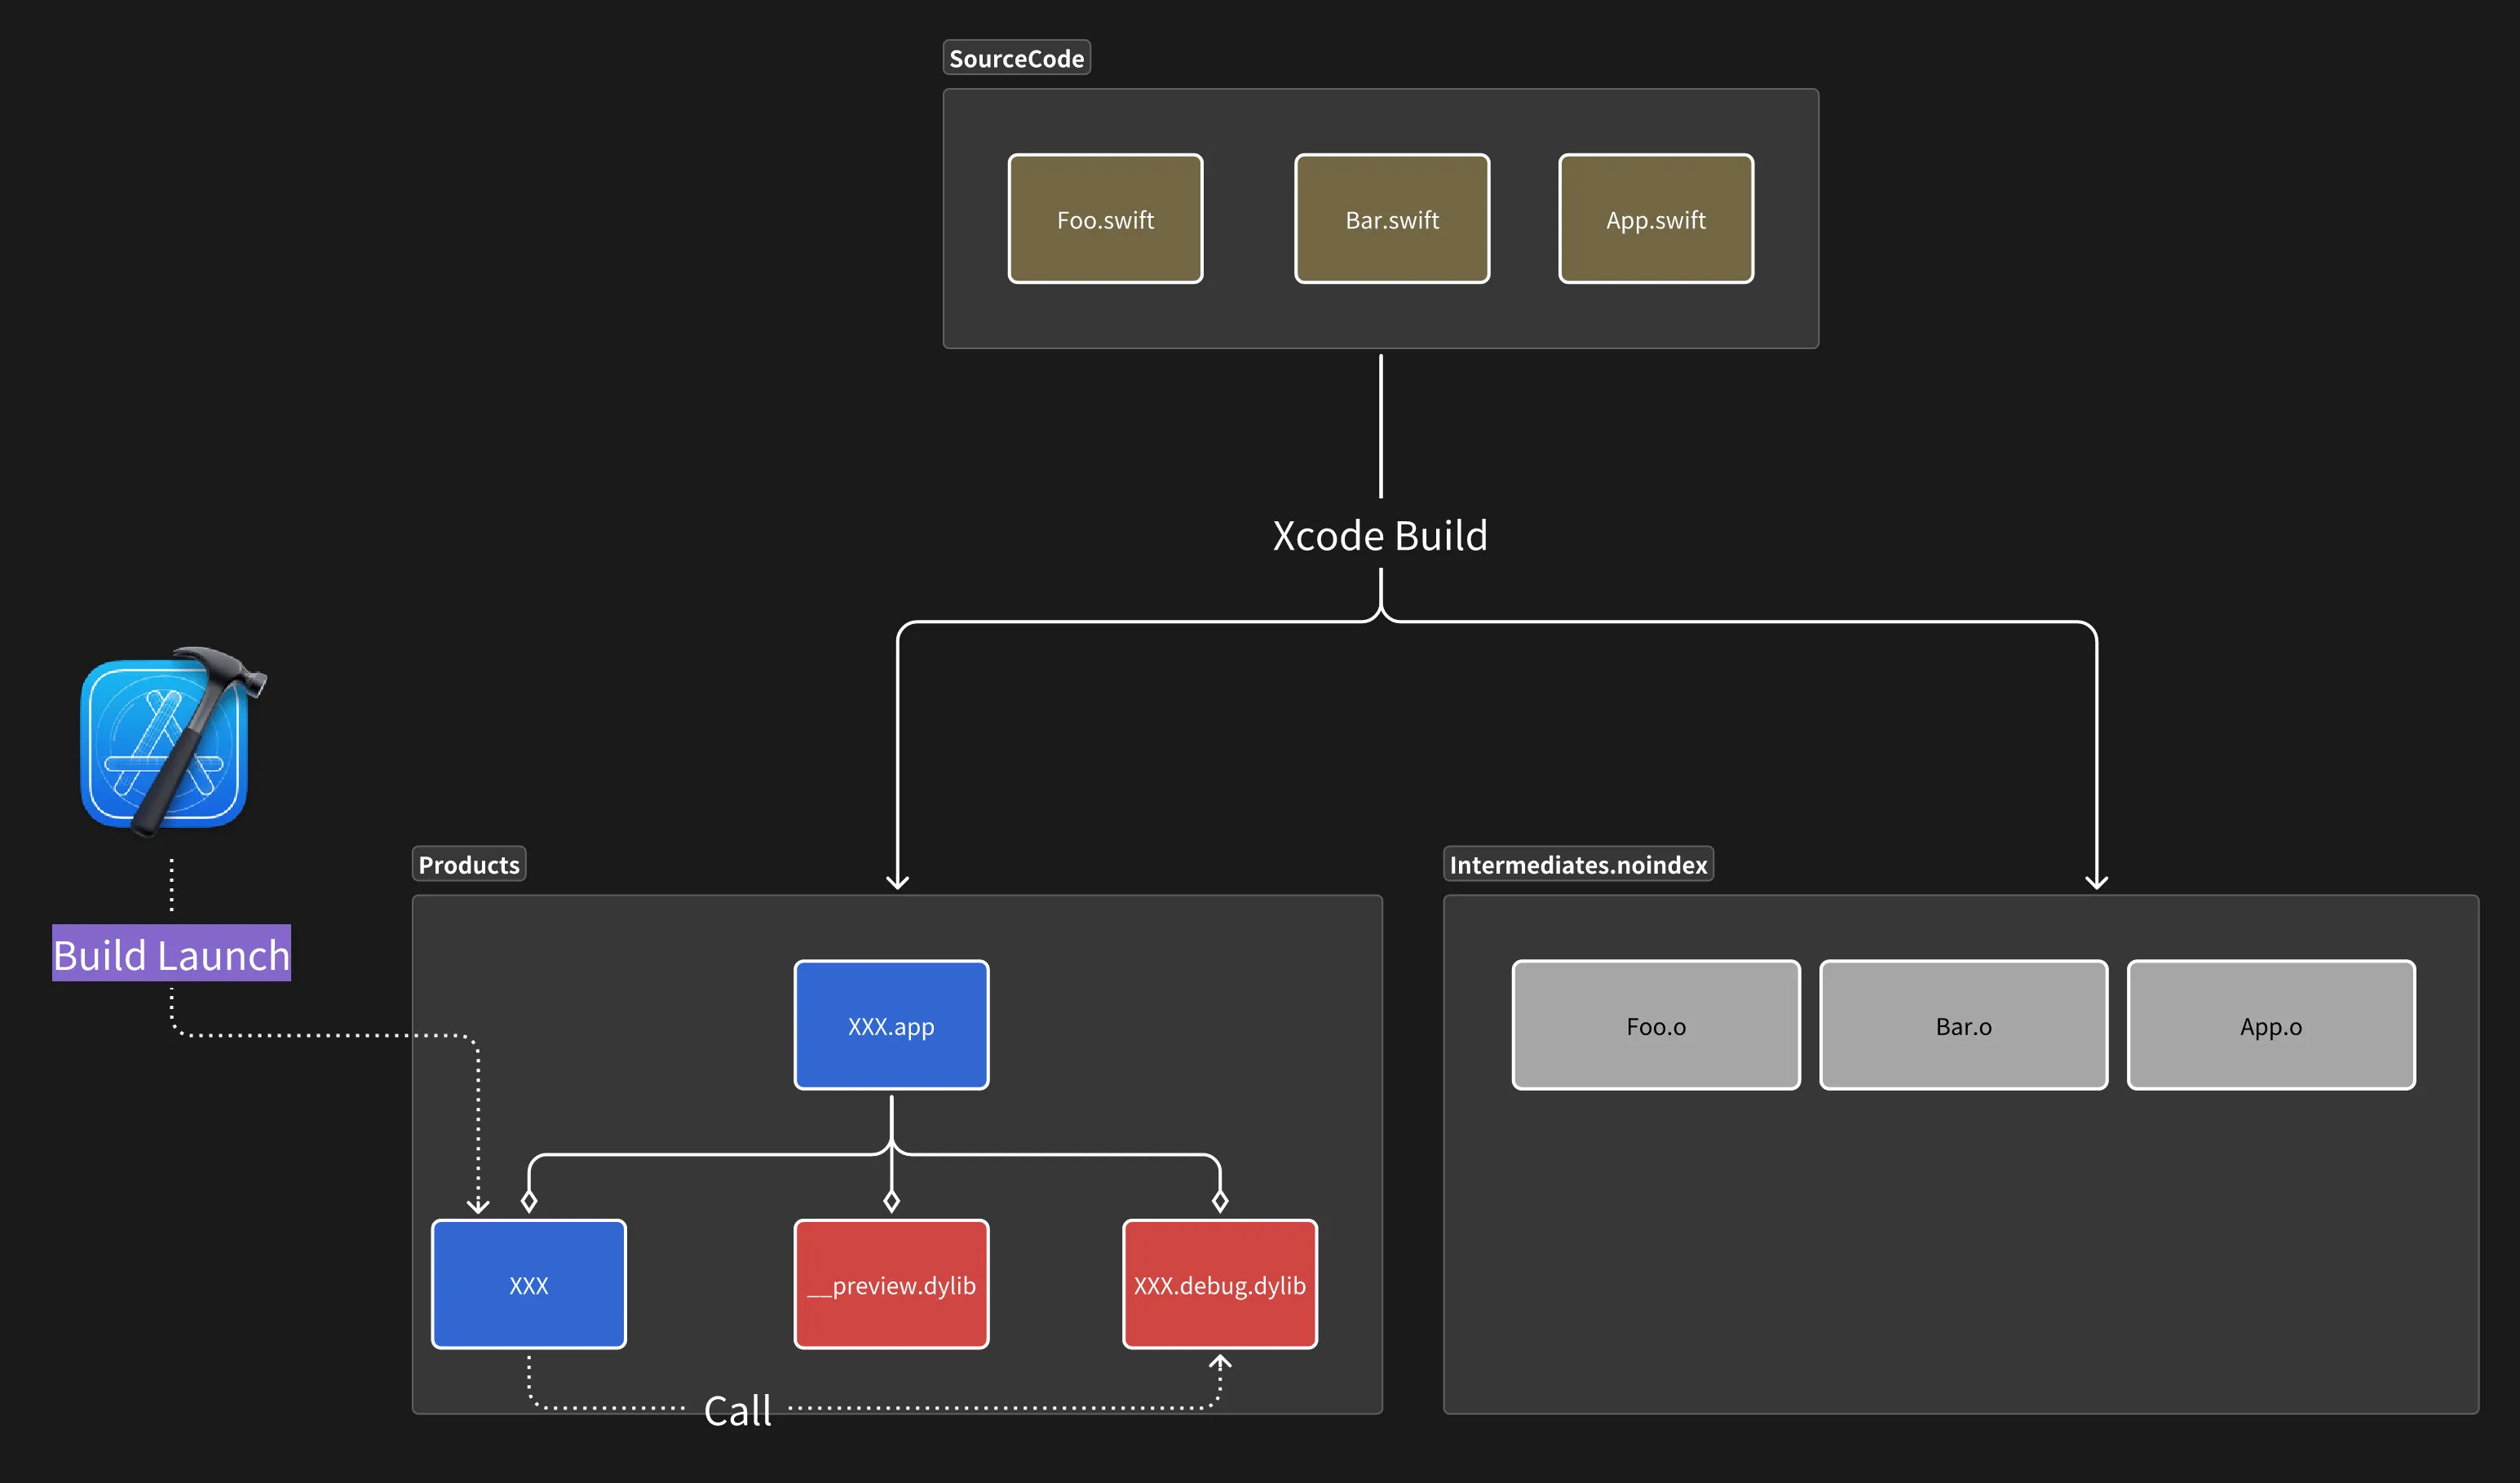
When we click Play, Xcode builds the entire project, with intermediate and final artifacts stored in the Build/Intermediates.noindex and Build/Products folders under ~/Library/Developer/Xcode/DerivedData/xxx/Build.
In the final .app, we typically see content like this:
XXX.app
  |__ XXX
  |__ __preview.dylib
  |__ XXX.debug.dylib
According to Apple’s official documentation, we know that to allow Preview and Build and Run to share build artifacts, when ENABLE_DEBUG_DYLIB is enabled in the project, Xcode will split the main content that was originally all in XXX.app/XXX into the XXX.debug.dylib dynamic library, while the original binary file becomes a “shell” executable that only serves as a trampoline.
To verify this, you can open any binary file from your complete project, and just from the size, you can see that as code increases, only the XXX.debug.dylib dynamic library grows larger.

When we start the binary, we can also use the lsof -p $(pgrep -f "") command to see that the binary indeed reads the debug.dylib dynamic library during the entire running process.
lsof -p $(pgrep -f SwiftUIPreviewSample)
COMMAND     PID USER   FD   TYPE DEVICE   SIZE/OFF                NODE NAME
SwiftUIPr 77422 onee  cwd    DIR   1,18        416           315720871 /Users/onee/Library/Containers/spatial.onee.SwiftUIPreviewSample/Data
SwiftUIPr 77422 onee  txt    REG   1,18      57552           316066805 /Users/onee/Code/Playground/SwiftUIPreviewSample/Build/Products/Debug/SwiftUIPreviewSample.app/Contents/MacOS/SwiftUIPreviewSample
SwiftUIPr 77422 onee  txt    REG   1,18     290816           264469085 /Applications/Xcode.app/Contents/Developer/usr/lib/libBacktraceRecording.dylib
So, in a normal Build and Run process, the entire binary’s build and execution flow would look like this:

Investigation: How Does a Preview Application Start?
When we enable Preview, the entire application’s build process begins to show some changes. First, during the build process, Xcode will generate special .preview-thunk.swift files for Swift source code files that use the Preview macro, which preprocesses the original Swift files.
In computer science, a thunk generally refers to a technique used to solve interface issues between different code segments. A typical example is converting callback-style asynchronous functions to async/await style functions, which we can call thunkify.
For example, if our source file looks like this:
import SwiftUI

let myText = "Hello, world!"

struct ContentView: View {
    @State var item = Item(name: "Hello!")
    @State var count = 0

    var body: some View {
        VStack {
            Image(systemName: "globe")
                .imageScale(.large)
                .foregroundStyle(.tint)
            Text("\(item.name) Foo, Bar, Baz")
        }
        .padding()
    }
}

#Preview {
    ContentView()
}
Then the corresponding .preview-thunk.swift file would look like this:
import func SwiftUI.__designTimeFloat
import func SwiftUI.__designTimeString
import func SwiftUI.__designTimeInteger
import func SwiftUI.__designTimeBoolean

#sourceLocation(file: "/Users/onee/Code/Playground/SwiftUIPreviewSample/SwiftUIPreviewSample/ContentView.swift", line: 1)
// 1. This marks the source file location
//
// SwiftUIPreviewSample
// Created by: onee on 2025/1/10
//

import SwiftUI

let myText = "Hello, world!"

struct ContentView: View {
    @State var item = Item(name: "Hello!")
    @State var count = 0

    var body: some View {
        VStack {
            Image(systemName: __designTimeString("#2282_0", fallback: "globe"))
            // 2. This uses the private functions imported at the beginning
                .imageScale(.large)
                .foregroundStyle(.tint)
            Text("\(item.name) Foo, Bar, Baz")
        }
        .padding()
    }
}

#Preview {
    ContentView()
}
Xcode mainly processes the original Swift file in two places: first, it uses #sourceLocation to mark the source file location for better error reporting optimization; second, it replaces text literals with __designTimeString to facilitate direct modification when text changes.
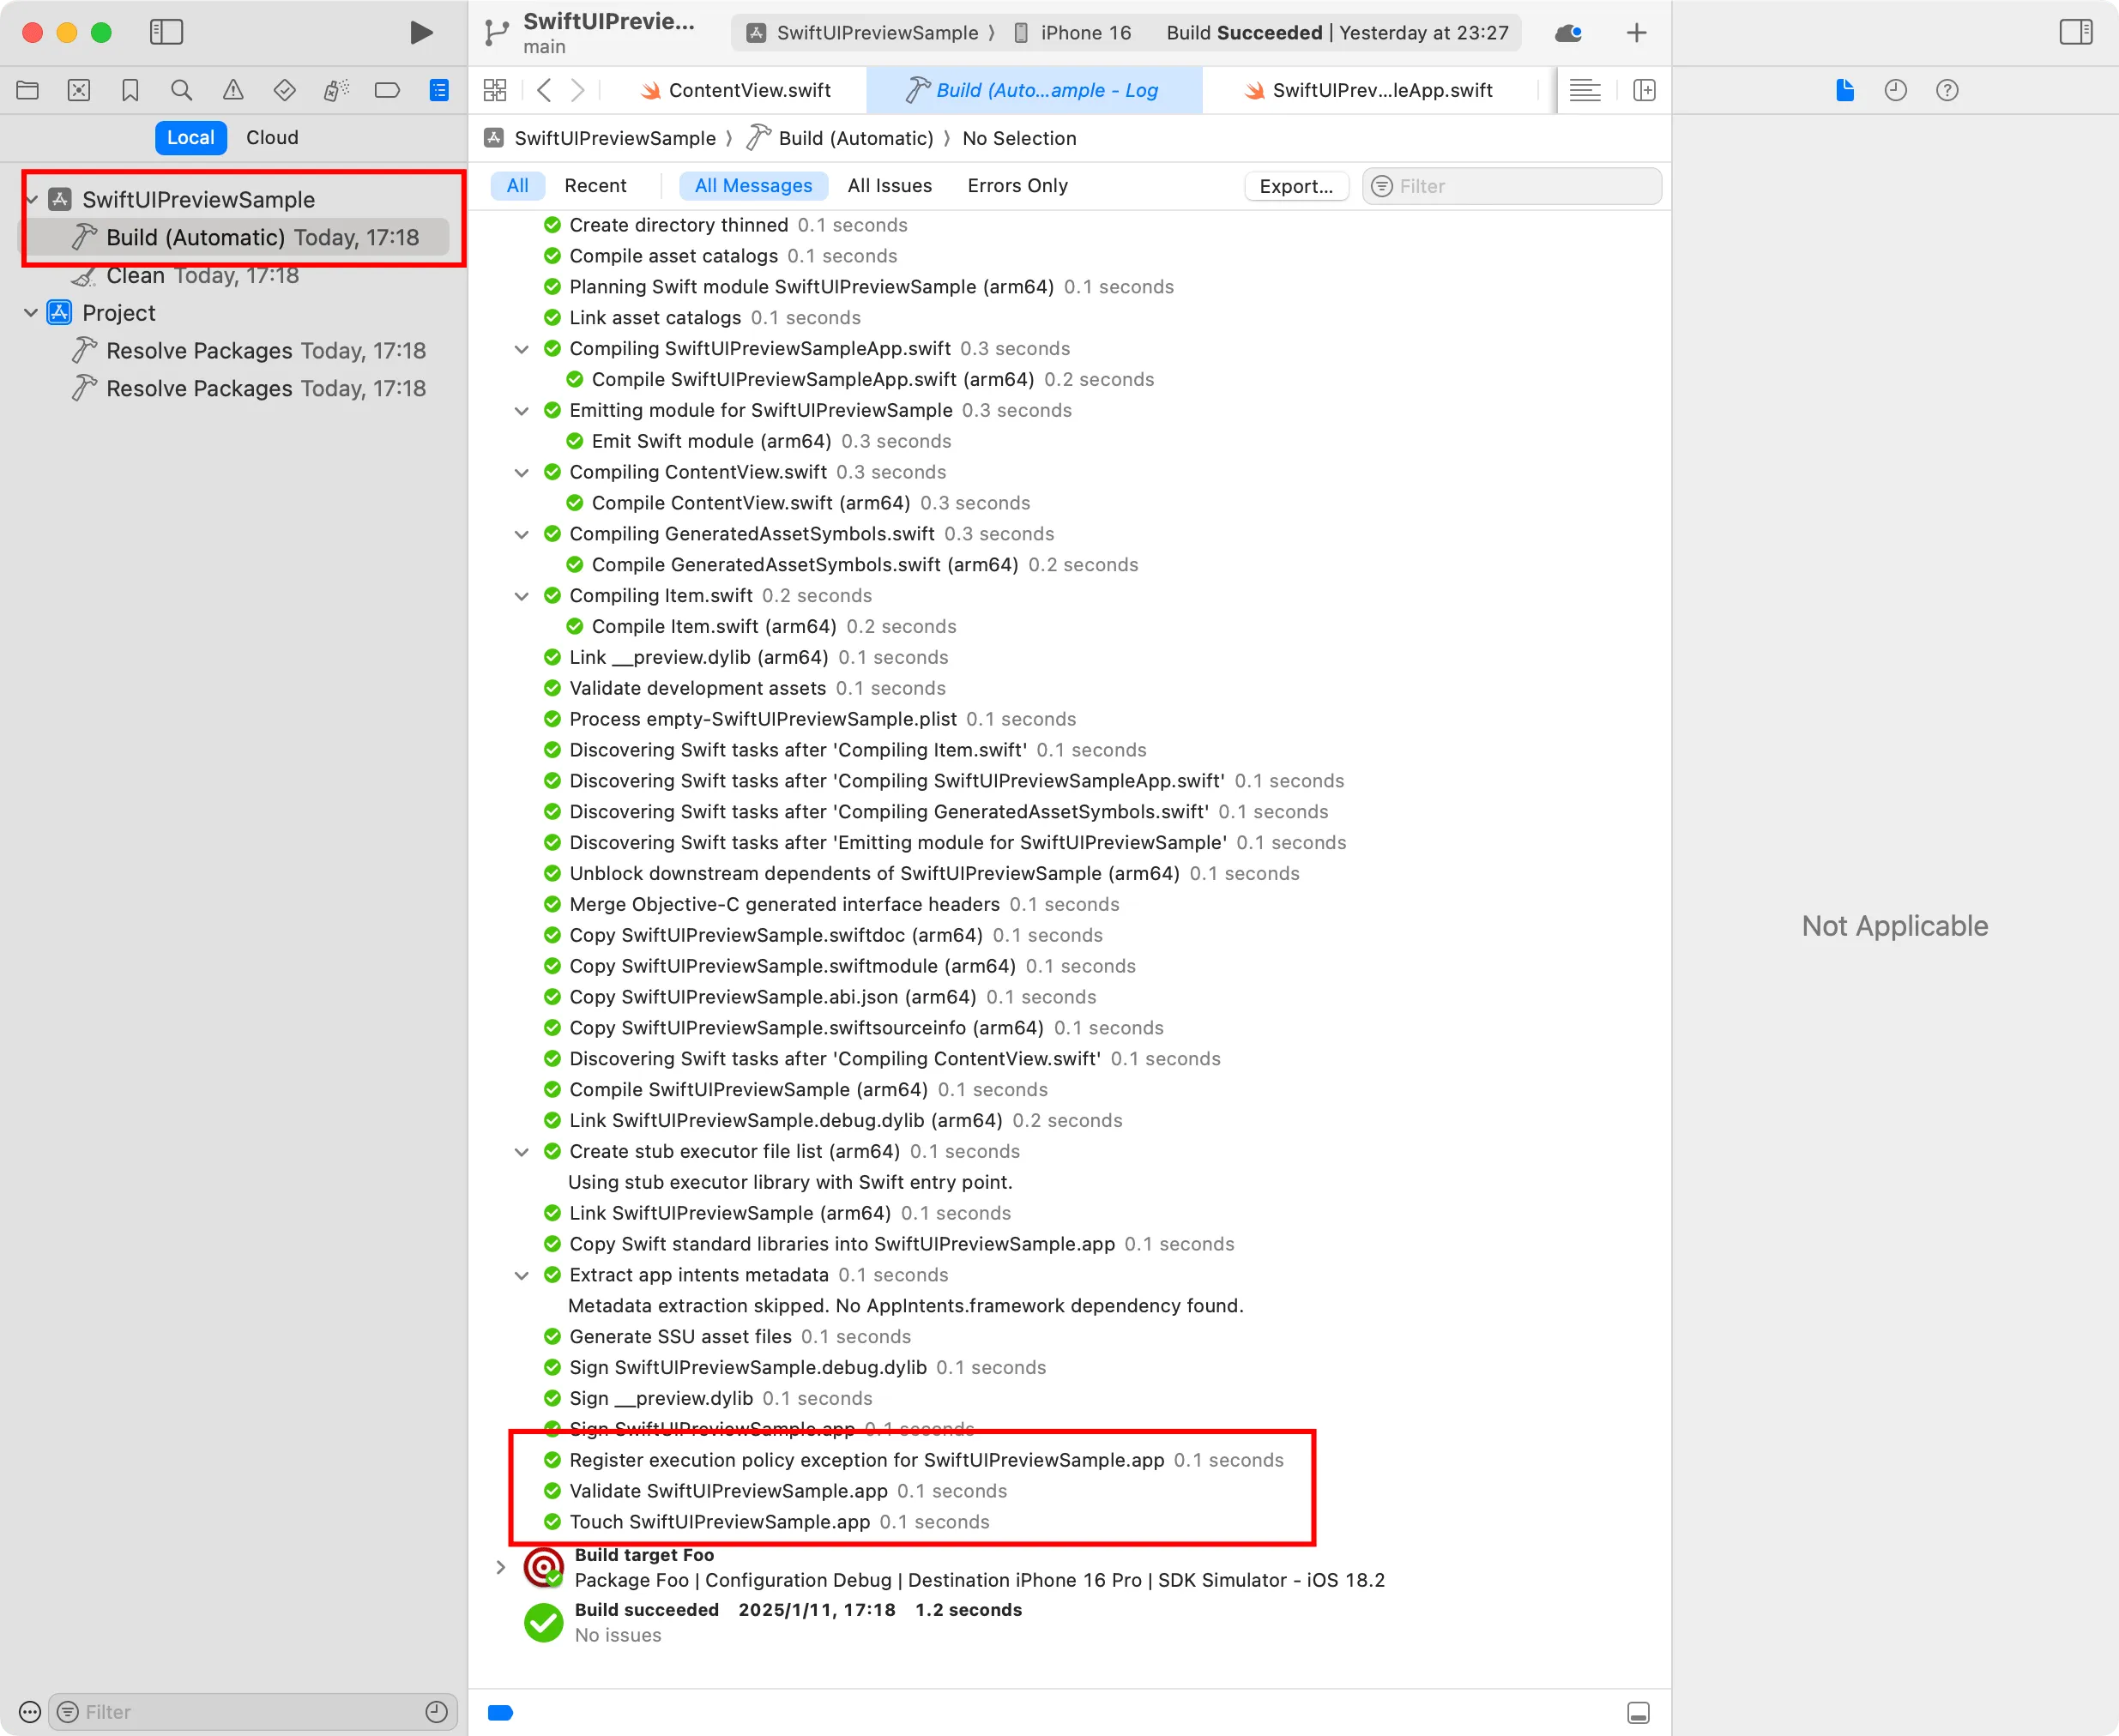
Besides generating these .preview-thunk.swift files, the rest of the build process is basically the same as a normal Build and Run build process. Xcode will build the entire project completely and ultimately generate the same .app file as a normal Build and Run. Additionally, we can view detailed information about the entire build process in Xcode’s Report Navigator.

Although we can deduce from the framework names that Preview uses JIT to execute code, in this investigation, we haven’t found the specific JIT execution details, such as the exact location of the binary content represented by ??? in the error logs. Therefore, in the current version of the diagram, we’ve put a question mark in front of the binary represented by ???.
If you have deeper insights into this aspect, feel free to leave a comment or contact me directly.
So far, we know what a Preview looks like when it first executes. What happens when we modify the code? How does Preview rebuild?
Preview’s Three-Layer Rebuild Strategy
As we mentioned at the beginning of the article, Preview has three different strategies for rebuilding applications. Let’s explain each with specific examples.
Small
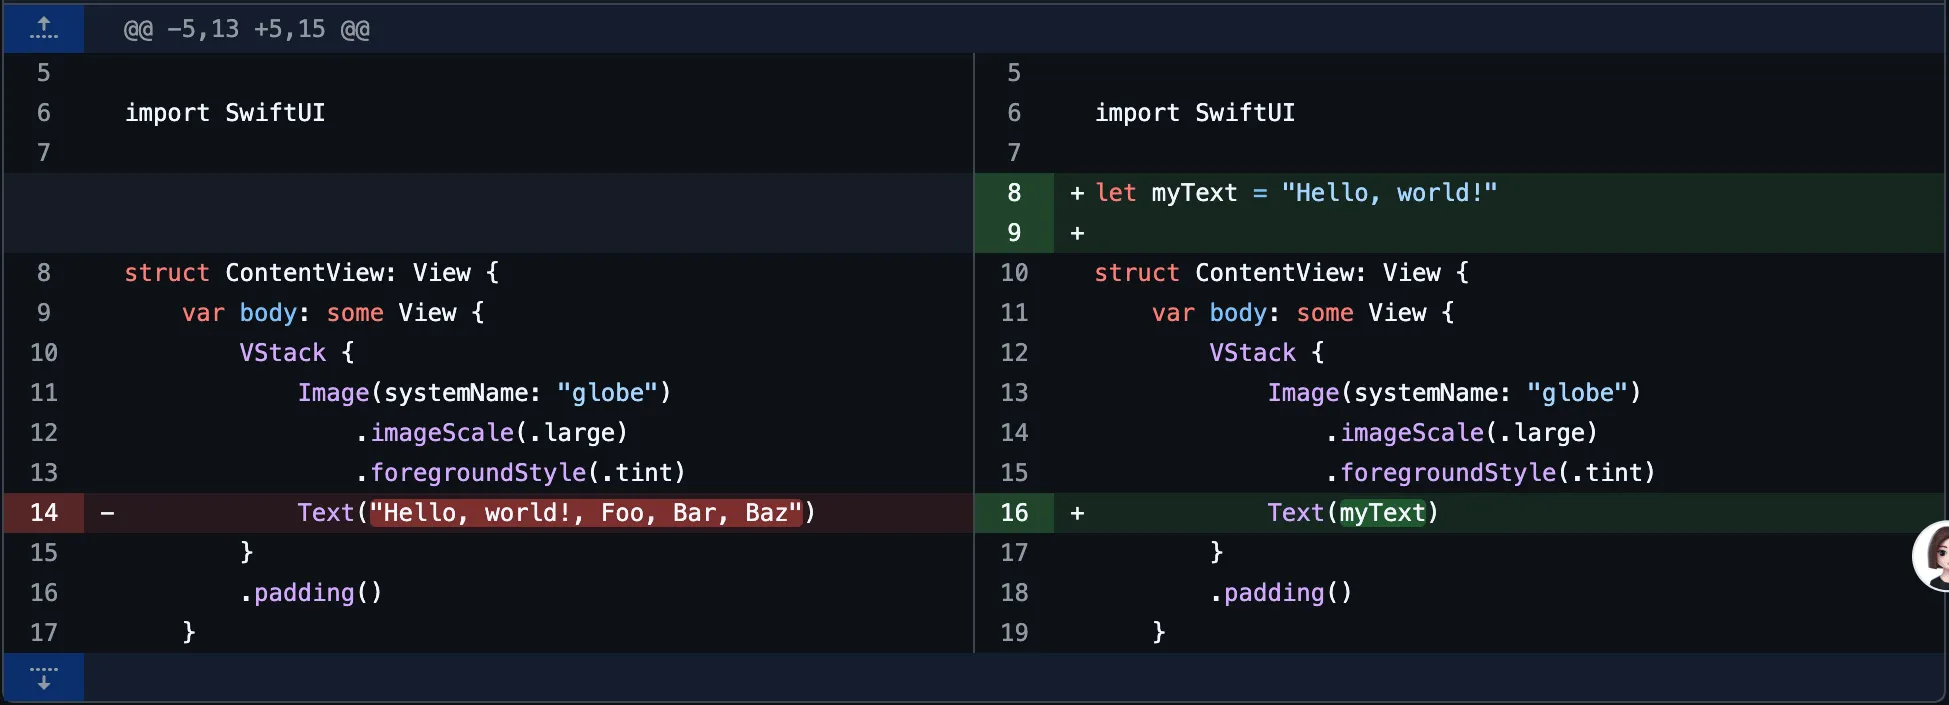
First is the smallest change: modifying literals in methods, such as this modification, where we changed the literal in ContentView’s Text from Hello, world! to Hello, world!, Foo, Bar, Baz:

Before this, in the thunk.swift file corresponding to ContentView, the Text code looked like this:
Text(__designTimeString("#25104_1", fallback: "Hello, world!")From the commit record, we can see that under this modification, the contents of the DerivedData folder didn’t change at all. Also, by comparing the PID from pgrep -f SwiftUIPreviewSample, we can see that the original SwiftUIPreviewSample process wasn’t destroyed.
Moreover, if we stored some variables using @State, modifications at the Small level can’t preserve these variables’ states. For example, if we change count from 0 to 1, after modifying the literal, the value of count will reset to 0.
So we can reasonably deduce that under this strategy, Xcode probably directly reads the literal content from the source code, then updates the new literal content to the existing SwiftUIPreviewSample process, and further updates the entire view by re-executing a series of methods created by the Preview macro.
When Preview re-executes, __designTimeString() will return the latest value of the updated string literal, thus achieving the text update in the view.
Middle
Next, if we modify other non-literal content in methods, such as changing a variable to a string with interpolation, like this modification:

From the commit record, we can see that in this case, Xcode will regenerate the .preview-thunk.swift file and corresponding .o files, but the regeneration scope is limited to the modified files, and the binary files and dynamic libraries under .app are not regenerated.
Also, through the PID from pgrep -f SwiftUIPreviewSample, we can see that the original SwiftUIPreviewSample process has been closed, and Xcode has generated a new SwiftUIPreviewSample process.
Therefore, we can reasonably deduce that under this strategy, Xcode only recompiles the source files with method content modifications, then updates the entire view by running a new SwiftUIPreviewSample process.
Large
Finally, if we modify class or struct properties, modify global variables, add @State, etc., such as this modification:

From the commit record, we can see that such modifications also update the binary files and dynamic libraries under .app. When such modifications occur, we can see the entire project’s recompilation log in Xcode’s Report Navigator:

Similarly, through the PID from pgrep -f SwiftUIPreviewSample, we can see that the original SwiftUIPreviewSample process has been closed, and Xcode has generated a new SwiftUIPreviewSample process.
Therefore, we can reasonably deduce that under this strategy, Xcode recompiles the entire project, then updates the entire view by running a new SwiftUIPreviewSample process.
Learning from Others: Comparing with Flutter’s Hot Reload
Although Preview has made some optimizations in Xcode 16, when compared with Hot Reload features of other frameworks, such as Flutter’s Hot Reload, the current version of Preview still has room for improvement:
- No breakpoint debugging support. In this aspect, Flutter’s Hot Reload not only supports breakpoint debugging, but breakpoint positions don’t drift after code modifications, which can be said to provide an excellent experience
- View states are reset. In comparison, Flutter’s Hot Reload preserves view states in most cases, which is much more convenient when debugging UI that requires state
- Overall implementation is more black-box. Flutter’s documentation thoroughly discusses how DartVM supports Hot Reload’s process and principles, while Apple is relatively lacking in this aspect
However, perhaps the Preview mechanism improvements in Xcode 16 are just a beginning, and hopefully subsequent versions of Xcode will have greater optimizations for Preview.
References
- Building Stable Preview Views — How SwiftUI Preview Works
- How to Preview SwiftUI Views with Core Data Elements in Xcode | Fat Bob’s Swift Notes
- Behind SwiftUI Previews | Guardsquare
- Understanding build product layout changes in Xcode | Apple Developer Documentation
- Code Injection with Dyld Interposing | by Noah Martin | Geek Culture | Medium

